December 14, 2011

OT: Unemployment Rates in the U.S.A.

A great example of a truly awful graph was posted on Flowing Data, starting a conversation on The Book.

I posted the following comment there:

Wexler/27 beat me to the BLS data sets... I will  note that the "discouraged" numbers can be found in the "characteristics of the unemployed" tables.  The different ways of parsing what constitutes "unemployment" are ways to try to get to the nuance in why people aren't working.  The narrow "actively seeking work" definition of defining who is in the labour market is a way to cut through demographic changes (e.g. in the post-WWII period, when most women were June Cleavering and not seeking work), increases in post-secondary enrollments, etc.
With that said, the increase in people who have thrown in the towel is, to me, one of the most disturbing parts of the current recession.
Wexler/7 and MGL/8 raise the question of attribution -- how much is the President (in the current circumstance, Obama) responsible for unemployment rates?
I dug up some historical U.S. unemployment rate data going back to 1948, and I have posted a chart of it to my own blog (because I have no idea how to do that directly).
A summary:  the current increase in unemployment started in the last year of G.W. Bush's 2nd term (rising from 5.0% in January 2008 to 6.8% by the November, the month of the election).  Going back, there was a peak in unemployment during the first G.W. presidency, and another that straddled G.H.W. Bush and Clinton.  And the worst unemployment rates since the Great Depression (higher rates and with a longer peak than the current phase) were during the first term of Ronald Reagan's presidency.  


Here's a chart of U.S. unemployment rates from January 1948 to November 2011:

And for those of you wanting to focus on the more recent period, the past 20 years (less a month):


I obtained the U.S. Department of Labor data set from the Economic Research pages of the Federal Reserve Bank of St. Louis here, and have converted that text file to an Excel file.

More Bureau of Labor Statistics (BLS) unemployment data can be found herehere and here.

-30-

November 21, 2011

Farm system success

Flip Flop Flyball has had a number of good infographics (and humour items) in the past, but their recent "Wins and loses throughout each team's system" chart is particularly interesting.  One thing that caught my eye is that no team in the Houston Astros system managed to break the .500 mark in 2011.


This raises a question in my mind. Can the current performance of minor league afflitates be used to predict MLB team performance at some future date?  (Economists would call this a leading indicator.)  All of the research on minor league performance that I'm aware of is in service of forecasting individual player performance. For good review of that work, see "The Projection Rundown" at Fangraphs.

But I'm wondering if the fluid nature of the minor leagues will yield any sort of meaningful result at the team level.  Not only are players constantly moving up and down between the levels, it also seems to me that they are every bit as likely (if not more so) to move mid-season from one organization's farm system to another (resource: Baseball America's listing of minor league players).  And the farm teams themselves are prone to shifting from one organization to another, and moving up and down the levels.  As one example, the Vancouver Canadians of the single-A Northwest League were affiliates of the Oakland A's for 11 seasons, but in 2011 came under to Toronto Blue Jays umbrella (they finished with a 0.513 record, second in their division).

Which then leads me back to the infographic: other than 2011 results, does it tell us anything?

-30-

November 14, 2011

Lewis & Beane interview

Moneyball (the movie) opens in the U.K. on November 25, and as part of the publicity, The Financial Times features an in-depth interview with both Michael Lewis and Billy Beane by Simon Kuper.

It's quite a revealing interview, that digs into the relationship between Lewis and Beane -- why Lewis was interested in finding the story, and why Beane let Lewis hang around.

But to whet your appetite, here's a couple of highlights. First, a quote from Michael Lewis:
"Baseball is a stupid-making enterprise in that nobody wants to be singled out or say something dumb. You wander in the clubhouse and it’s amazing how incurious the players are. One reason I was attracted to Scott Hatteberg [the former A’s player] as a character: he was just curious: ‘What the hell are you doing here, man?’”

On the criticisms of Moneyball:

There are two silly objections often made to Lewis’s book. The first is that if Moneyball works so well, then why haven’t the A’s had a winning season since 2006? We meet on a sunny October morning, mid-playoffs, a perfect day for baseball, but the team’s season has long since ended.

However, the people who make this objection don’t seem to grasp the basic principles of imitation and catch-up. Once all teams are playing Moneyball, then playing Moneyball no longer gives you an edge. Indeed, the richer clubs have the means to play it smarter. The New York Yankees recently hired 21 statisticians, Beane marvels.

The other common snipe is that Beane should never have spilled his secrets to Lewis. That ruined the A’s, the critics say. But Lewis dismisses the charge. First, he notes, Beane had never imagined their conversations would spiral into a book. Lewis says, “I was going to do something little. By the time I thought I was going to do something big I’d hung around so much it would have been socially awkward to ask me to leave.”

Second, notes Lewis, by 2002 Moneyball was already spreading. The book ends with the Red Sox offering Beane the highest GM’s salary in baseball history. Only when Beane turned them down, having decided after Stanford that he’d never do anything just for money again, did the Red Sox hire Epstein. “The market was moving already,” says Lewis. “The teams that wanted to do it were going to do it anyway, so no book was going to make any difference. My view is the only effect of the book was to give them [the A’s] the credit. If no book had been written, Theo would have been branded the man who reinvented baseball.”

Of course, Epstein's stuff worked in the playoffs.

-30-

November 7, 2011

The Bayes Ball Bookshelf, #2

Baseball Analyst, 1982-1989 (Bill James, publisher and editor)

SABR is now hosting -- the the blessing of Bill James, and through the work of Phil Birnbaum -- the complete Baseball Analyst.  Between 1982 and 1989, Bill James published 40 issues of Baseball Analyst, which in retrospect is now recognized as the launch pad for some fundamental thinking about using quantitative approaches to understand baseball.

The initial issue got off to a great start, with an article about fielding by Paul Schwarzenbart. In his introduction to the issue, James writes that the article "demonstrates that fielding statistics, like batting and pitching but apparently even more so, are the products in part of circumstances as well as men." This is a topic that, 30 years later, continues to provide plenty of fodder for analysis (e.g. this blog post from a month ago by Tangotiger, "Not all fielding opportunities are created the same").

In later issues, there are articles covering the usual parade of topics: clutch hitting, ballpark effects, how much young pitchers should work, ageing of ball players, and of course movie reviews.

There's also familiar names: Pete Palmer, Phil Birnbaum, and Bill James himself.

All in all, Baseball Analyst is an interesting time capsule. The tools the sabermetric community use to communicate have shifted -- when was the last time you subscribed to a magazine produced on a typewriter and mimeograph? But more importantly, it demonstrates how thinking about these topics has shifted. This shift is both because of further research (we know more than we used to) and because of the proliferation of data and cheap computing power

But it also shows that in spite of 30 years of analysis, there are still many questions unresolved.

-30-

October 18, 2011

World Series prediction: the Bill James method

Bill James developed a method for predicting playoff series winners, last updated in the 1984 edition of Baseball Abstract in an essay titled "The World Series Prediction System, Revisited".  At that point, it had a pretty good track record -- 73% success in predicting the winner of all the postseason series in the 20th century.

Mike Lynch over at seamheads.com used the method (without any adjustments, updates, or other tweaks) to predict the 2010 World Series -- which correctly identified the Giants.

This year, Lynch has again used the tool and tabulated the Rangers and the Cardinals according to the Bill James method. 

The result:  the Rangers come out as solid favorites.

(A couple of other older references to previous use of method are here and here. Other than that, I haven't found anything on the web that uses or updates the method.)

-30-

October 17, 2011

World Series prediction

The 2011 World Series starts in a couple of days, and it's time for the pundits to come out and make their predictions.  Over on coolstandings.com they've posted their prediction for the World Series.  Here's a screenshot of their "smart" prediction:


(The "dumb" prediction is 50/50 for either team, so there's no point talking about that. And I've posted a screenshot, since their predictions are live and will change upon the outcome of the first game of the World Series. An example of the Monty Hall problem, in real life.)

To summarize:  Texas shows as having a 68.2% probability of winning the World Series.

I'm not sure of the details of their methodology, but we can use each team's regular season win/loss record to employ the "log5" approach to come up with our own prediction.  So I did that, and my first prediction is for a Texas victory (58% probability) -- and if pressed to predict the series length, it would be Texas in 6 games (17% of the outcomes are Texas 4-2).  Both probabilities are substantially lower than the coolstandings prediction.

But we can be a bit more sophisticated in our approach, using an adjusted win/loss percentage that employs a Bayesian adjustment to each team's final result.  (This is the same method I used back in May for the early season results -- after 162 games the impact of the prior is much reduced.) This changes Texas' winning percentage to 0.571, and St. Louis to 0.543.  (Google doc spreadsheet here.)  Using the log5 formula, this gives the Rangers a 0.538 edge over the Cardinals.

Working through the 7 game series, Texas' probability of winning the World Series is 56%.

And we can be still more clever, by considering the road/home splits of each team.

Team      W-L     %   posterior
-------- -----  ----  ---------
Texas    96-66  .593   .571
- home   52-29  .642   .591
- road   44-37  .543   .527


St Louis 90-72  .556   .543
- home   45-36  .556   .535
- road   45-36  .556   .535


The home-road splits improve things for the Cardinals, since they had a better home record than Texas' road record and thus become more likely to win a home game. As well, the Cardinals have home field advantage (but only on game 7 -- the Rangers have home field advantage in a 5-game series. But I digress.)  After using the home-road splits, Texas still remains the favorite, but the probability is down to 54%.

While my approaches still give Texas the biggest likelihood of victory, my estimates are less emphatic than the probabilities over at coolstandings.  Based on the characterizations used at coolstandings, my methods lie somewhere between "dumb" and "smart".  "Average intelligence", perhaps.

Tow Mater says "Rangers in 6. But I had the Phillies and the Brewers beating the Cardinals, too".

-30-

October 7, 2011

WPA contribution infographic

I like these WPA word cloud graphics from SB Nation by Kevin Dame, describing the player contributions in last night's Tiger-Yankee ALDS game 5.  (From
http://mlb.sbnation.com/2011/10/7/2474640/yankees-tigers-game-5-visual-box-score.)


One of the things I like is that they emphasize that that WPA (Win Probability Added) is circumstantial. 

For the Tiger pitching staff, the starter Fister gave up only one run over five innings (that is, four scoreless innnings), but gets a smaller font than the closer Valverde who worked only the scoreless ninth inning.  An easy example is Fister worked a 1-2-3 1st innning with a 2-0 lead, which was worth 0.052 WPA.  By contrast, Valverde's 1-2-3 9th inning with a one-run lead (3-2 score), was worth 0.222 WPA.  Being later in the game and with a tighter score yielded a higher WPA.

And for the Yankee hitters, ARod's strikeout to end the game (the end of Valverde's 1-2-3 ninth) was only one-third as important to the Yankee defeat (-0.053 WPA) as Swisher's strikeout to end the 7th inning, when the bases were loaded (-0.154).  Of course, on Swisher's strikeout Tiger pitcher Joaquin Benoit set himself up for the big 0.154 WPA by coming in with a runner on 1st, then giving up two singles to load the bases, followed by a walk to close the lead to one run.

(The Fangraphs box score has the details that were used to make the word clouds, while the individual play log, with the WPA for each at-bat, is here.)

-30-

October 4, 2011

Actuarial baseball

Been off the grid for a while...

A couple of weeks ago, Josh Hamilton of the Rangers hit a grand slam that got an above-average amount of attention, since it was tied into a promotion being run by a flooring company.  The title of this article describing the homer could instead be "Josh Hamilton's grand slam yields big insurance payout":
http://espn.go.com/dallas/mlb/story/_/id/6971469/texas-rangers-josh-hamilton-slam-triggers-free-flooring-payout

Somebody, somewhere, in some insurance company, sold coverage for this promotion.  And that same somebody (we hope) must have sat down and calculated the probability of Hamilton hitting a grand slam over a one month period, and set the premium based on that probability.

Summary:  insurance is gambling.

-30-

August 9, 2011

Bayes book

I recently learned about a new book by Sharon Bertsch McGrayne, The Theory That Would Not Die: How Bayes' Rule Cracked the Enigma Code, Hunted Down Russian Submarines, and Emerged Triumphant from Two Centuries of Controversy.

I haven't got a copy yet, but based on a couple of reviews, it seems like it's going to be a good read. The review in Significance magazine describes it thus: "At times reading like a historical account, at times like investigative journalism, at yet other times like a statistical commentary."

Other reviews:  New York Times Sunday Book Review, Boston Globe, and Nature (subscription required for on-line access).

-30-

June 30, 2011

Physics of baseball

In 1990, I read a great little book called The Physics of Baseball by Robin K. Adair (now in its third edition).  It's strongly recommended to anyone interested in the subject matter.  And here's a short Q&A with Adair at Popular Mechanics from a couple of years ago.

But a few other items of note on this subject have popped up recently.

First, a great chart at The Book, with the speed of the ball off the bat as the X axis and the angle of launch as Y, showing the outcome (from ground ball to home run) at the points X,Y.

Then, there's an article in the latest issue of the American Journal of Physics by Faber, Smith, Nathan, and Russell called "Corked bats, juiced balls, and humidors: The physics of cheating".  You can also find a short summary of the article at Smithsonian.com

There are three questions asked, each with a nuanced answer.

1. Question: "Can a baseball be hit farther with a corked bat?"
Answer: "... while corking may not allow a batter to hit the ball farther, it may well allow a batter to hit the ball solidly more often."

2. Question: "Is the baseball juiced?"
Answer: The researchers "found no evidence that baseballs of today are more or less lively than baseballs used in the late 1970s."

3. Question: "What's the deal with the humidor?" (Or, "is it plausible that the humidor accounts for the decrease in offensive statistics at Coors Field since 2002?"
Answer: Yes.

For those interested in a deeper dive into this topic, one of the co-authors of the study, Alan Nathan, has a page dedicated to the physics of baseball.


-30-

Update 2011-07-13:  Tango at The Book posted a link to the Smithsonian article, and there has been plenty of commentary including a number of responses from Alan Nathan.

June 1, 2011

Two months in, a Bayesian look at the standings

At the end of April, I posted "Early season standings and Bayes" that took two different approaches to regressing the early season standings to come up with a prediction for the eventual result for the full season.

So here we are at the end of May, and there's been a lot of movement in the standings, so here's an update to the spreadsheet. Although the Phillies and the Indians remain at the top of the standings, they are starting to regress downwards. At the end of April, both teams were "on pace" to win 112 games in the season, but the regression showed a more modest result of 93 wins. A month later both teams are "on pace" to win 100, but the Bayesian approach suggests that they are more likely to win 91 games.

If you are a Twins or an Astros fan, there is no solace in the fact that both teams have not regressed toward the mean over the past month, but have instead continued to play at roughly the same level they exhibited in April. The regression model now predicts the Twins will end up at 65 wins, which would be the lowest in MLB. Of course, this prediction is based only on the team's performance to date -- it doesn't consider the number of injuries the Twins are currently dealing with.

-30-

May 29, 2011

Ouch

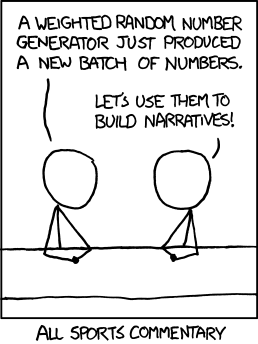
XKCD on sports.  Is there a way to test (in a quantitative manner) the hypothesis that baseball is the worst offender?


-30-

May 6, 2011

When labour market research goes to the ballpark

In a recently issued paper called "Productivity, Wages, and Marriage: The Case of Major League Baseball", economists Francesca Cornaglia and Naomi E. Feldman examine the "marriage premium" -- the fact that controlling for other influencing factors, married men earn more than unmarried men. In most situations, a variety of confounding variables muddy the waters -- things like geographic location, differences across occupations, and poor productivity measures. Cornaglia and Feldman innovatively use information from MLB to control for those variables.

Derek Jeter, the exception that proves the rule.

The abstract:

Using a sample of professional baseball players from 1871 - 2007, this paper aims at analyzing a longstanding empirical observation that married men earn significantly more than their single counterparts holding all else equal. There are numerous conflicting explanations, some of which reflect subtle sample selection problems (that is, men who tend to be successful in the workplace or have high potential wage growth also tend to be successful in attracting a spouse) and some of which are causal (that is, marriage does indeed increase productivity for men). Baseball is a unique case study because it has a long history of statistics collection and numerous direct measurements of productivity. Our results show that the marriage premium also holds for baseball players, where married players earn up to 20% more than those who are not married, even after controlling for selection. The results are generally robust only for players in the top third of the ability distribution and post 1975 when changes in the rules that govern wage contracts allowed for players to be valued closer to their true market price. Nonetheless, there do not appear to be clear differences in productivity between married and nonmarried players. We discuss possible reasons why employers may discriminate in favor of married men.

You can hear Dr. Cornaglia discuss the research on the BBC programme More or Less (2011-04-29), starting at roughly 10'50".

My initial reaction regards neither the findings nor the methodology, but the fact that other than a mention of the Lahman database, the list of references does not include any of work of the sabermetric research community. At one point in the discussion of productivity measures the authors write "Most modern-day baseball enthusiasts and commentators consider the latter two statistics [OPS and EqA] to be the most accurate measures of a player’s productivity", but the authors neither refer to any authority to support that statement nor discuss fact that others have critiqued those measures.

This is not the first time that academics have utilized the contributions of the sabermetric community in supporting their research (in this case, it provides a vital element in the foundation of the productivy measure) but then failed to acknowledge that work. For a well-reasoned discussion of that topic, please read Phil Birnbaum's "Chopped liver II".

-30-

May 1, 2011

Early season standings and Bayes

Early season performance has been a hot topic this year (not that it isn't a topic of discussion every year).  I wrote about it, using a simple approach of assuming that every team is .500, and a more recent addition in the blogosphere is Rob Neyer's take.

Last week Kincaid over at 3-D baseball had great post that used Boston's 2-10 start to go down a detailed and more sophisticated Bayesian path to estimating the team's true talent.  Tango posted a link to Kincaid's blog, and added a few details that incorporate actual observations.  A key element in this is that the observed spread of talent is wider than the theoretical .500 level of all teams.  (If all teams were .500, the random component would result in a standard deviation of 0.039. In reality, the standard deviation is wider, at 0.071 -- the implication of this is that there are real talent differences between teams, with some teams having a true talent level above .500 and others below.)

My modest contribution to this thread is here:  a Google doc spreadsheet that show all of the MLB team's current record (as of 2011-04-30), and then takes two different Bayesian-based methods to predict each team's final season outcome.

The first set are the yellow columns, which replicate Kincaid's "shortcut" approach, with the implied regression of 69 games noted by Tango. The blue columns take a different approach that uses the standard deviation of both the observed performance to date and the long-term observations (every MLB team season outcome from 1961-2010) as the prior.

The difference in the result generated between these two approaches is relatively modest.  (It's worth noting that the relative position on the standings does not change.) What is apparent is that with roughly 25 games played this season, there are solid differences appearing in the team performances.  This method forecasts that Cleveland and Philadelphia will regress downward from .692 (a 112 win season) to .573 and end up with 93 wins. At the bottom of the table, it suggests that the Twins will improve from .346 (58 wins on the season) to .444 and a much more respectable 74 wins over the course of the season.

-30-


April 28, 2011

Words with meaning

Article at Slate entitled "Turning words into touchdowns", on the work of Achievement Metrics. This company takes interviews from various players and parses them, and then correlates the pattern with on- and off-field performance.  From AM's website:

Our analyses of players’ speech, arrest, and suspension data have shown that differences in players’ speech while in college can predict which players are more likely to exhibit off- and on-field behavioral problems during their professional careers.

I'm not sure whether this would work for baseball, since the players just speak in clichés. (Warning: clip includes profanities.)

-30-

April 19, 2011

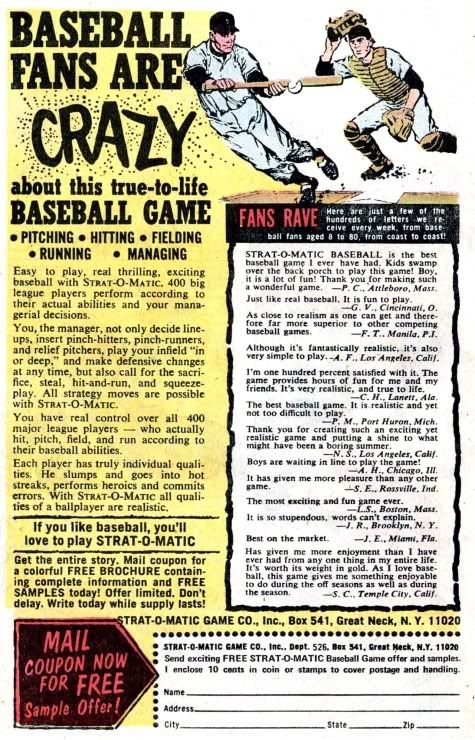
Baseball fans are crazy

Or so says this ad for Strat-o-matic, posted at If Charlie Parker was a Gunslinger...
 (Note: the main Charlie Parker page is not appropriate for at-work viewing.)


(Click the image to enlarge.)

-30-

April 12, 2011

Kicking at the darkness

Last night (2011-04-11) the Seattle Mariners pulled off a preposterous comeback, defeating the Blue Jays 8-7 after trailing 0-7 heading into the seventh inning. Other teams have had comebacks from being down by 7 runs, and pulled off comebacks in bigger games. But as Rob Neyer has pointed out, what made this so unexpected and so special was that the Mariners have been, in a word, hapless. The early part of this game was the best/worst example of their struggles.

The FanGraphs plot (chart below) follows what has become a disturbing Mariner trend this year -- the line quickly plummets to the sub-10% win expectancy range in the early innings, and slowly drifts towards zero from there. (Check out the games vs. Cleveland the day before and the home opener on 2011-04-08 for recent examples).  This time, after bottoming out at 0.3% when Luis Rodrigez (the game's eventual hero) struck out to lead off the Mariner half of the seventh inning, the WE line zigzagged its way to the other end of the scale.

Blue Jays @ Mariners, 2011-04-11 (source: FanGraphs)


For the Mariners, a second consecutive 100 loss season (which would be the third in four seasons) is not at all out of the question. But for the fans who stuck with it last night, this was one for the ages.  Or the U.S.S. Mariner game summary, quoted here in its entirety: "That was horrible, then awesome. Baseball is fun."

The title I used for this entry is a reference to Bruce Cockburn's song "Lovers in a Dangerous Time". In the article linked above, Neyer wrote "It was somebody smart, or maybe an episode of Scrubs, that said nothing worth having comes easy." The song contains the line "Nothing worth having comes without some kind of fight/Got to kick at the darkness until it bleeds daylight". In the late innings of last night's game, the Mariners showed some kick.

-30-

April 11, 2011

Social mobility toward the mean

The April 8, 2011 edition of the BBC radio program More or Less* includes a discussion of regression toward the mean in the context of social mobility stats in the U.K.  Most of the analysis has focussed on the impact social class has on long-term education outcomes. In particular, much has been made of the fact that the analysis suggests that the low ability children from high social class catch up and pass the high ability children from low social class. 


But in the broadcast Daniel Read, professor at Warwick Business School, has offered a critique (link to written version) that points out that the analysis has not accounted for "one of the oldest statistical problems of all" (the BBC's description): regression toward the mean. The source of the problem is correctly identified as the bias introduced by including only the highest and lowest performers in the groups shown in the chart. The children closest to the mean for that social class have been excluded.

Because only the extreme ends of the education outcomes tests of the two social class groups have been selected, the poorest performers naturally show improvements while the higher performers show declines. From the broadcast:
It's not that it's [the differences in outcomes between social class] all fluke. But if there's any element of luck at all -- which there surely is, because we're talking about ability tests for toddlers -- then we have to allow for what we'd expect to happen when that luck fails to last.  And what we'd expect to happen is pretty much what the graph in the government's social mobility strategy shows, which is that the next time you test the children all the high performers have dropped off. But especially the poorer kids who, remember, Nick Clegg says were disadvantaged from birth. And all the lower performers have caught up, but especially the richer kids. And then as you continue to test, the richer kids gain on the poorer kids at a very much less dramatic pace.
The easiest way to spot the regression towards the mean? The enormous change from the first to the second measurement, as much of the selection bias at the first measurement point disappears. The high and low performers were selected not on the basis of their long-term outcomes, but on the results of the first test. In subsequent tests the children in these extreme cases will move toward the mean, and closer to their "true talent".

Accounting for regression toward the mean does not mean that social class doesn't have a relationship with education outcomes. But accounting for the regression toward the mean would moderate the magnitude of the difference between the two social classes.

*The linked page has a text summary of the program, a copy of the chart in question, streaming audio of the program, and links to the podcast and supporting documents. The item begins at roughly 17' 25" of the podcast.

-30-

April 10, 2011

Meaningless numbers

There's been plenty of chatter on the sabermetric blogs lately about the meaningless stats bandied about by broadcasters during the early stages of the season.  The best way I've seen the validity of these numbers debunked is on Jeff Sullivan's post on the Indians-Mariners game at Lookout Landing (on SB Nation):

In the bottom of the first, the broadcast flashed a Justin Masterson [the Indians' starting pitcher] stat graphic showing his lefty/righty splits on the season. After one game. The only thing I wish is that they would've shown his home/road splits instead.

-30-

April 8, 2011

On pace for a 162 loss season!

Two days ago I responded to an on-line article about the Orioles' 4-0 start to the season, pointing out that it's not at all surprising -- using the laws of binomial probability -- to see three of the 30 MLB teams at 4-0 to start the season.

What I didn't mention were the teams that started the season on a losing streak. And now, heading into this weekend's play, the 0-6 Red Sox and Rays that are getting the attention of the punditocracy.  For the Red Sox, it's the poorest start since the 1945 season, and the Rays haven't ever gone 0-6 to start the season in their comparatively short history.

Some writers have acknowledged the probability and the history of being 0-6:  Dave Cameron at FanGraphs writes "Is it time to panic in Boston?", and Cliff Corcoran at S.I.'s piece is "It's still early, but history is against winless Red Sox, Rays and Astros" (which was written before yesterday's games, when the teams were 0-5).

An entirely different view can be found Baseball Prospectus, where Steven Goldman uses the 1987 Brewers, who went 13-0 and then 20-3 (Goldman writes, "on pace for a 141 win season") before hitting a 12 game losing streak, and the opening sequence of Tom Stoppard's existentialist play Rosencrantz And Guildenstern Are Dead to suggest that sometimes things operate outside the laws of probability.

(Watch the scene in question, from the 1990 film with Gary Oldman and Tim Roth as the title characters.)

In the play, the characters are faced with a preposterously long string of coin-flips that land heads. This leads Guildenstern to say "A weaker man might be moved to re-examine his faith, if in nothing else at least in the law of probability."

Even though the two teams are 0-6, the weakness of my faith in the laws of probability is not yet tested.

-30-


April 7, 2011

Gelman on baseball

Andrew Gelman has published a few blog articles lately that hit on baseball.

First up, "Bill James and the base-rate fallacy", where he points out a flaw in James' reasoning that arises from the "availability heuristic".

Second, at The Statistics Forum, a comparison of predicting future performance at a significant transition point in "Minor-league Stats Predict Major League Performance, Sarah Palin, and Some Differences Between Baseball and Politics".

I don't have anything to add, other than to say it's encouraging to see one of the best statistical thinkers in the academy using baseball as a point of reference.

-30-

April 6, 2011

On pace for a 162 win season!

Only at the beginning of the season would a four-game winning streak get you an article on S.I.

The probability of a true .500 team playing four games against other true .500 teams and winning them all is 6.25% -- or roughly 2 out of 30. In other words, at this point in the season we could realistically expect two teams to be at 4-0.  Once we consider that in real life teams are not so perfectly matched, thus raising the odds of the more powerful team being successful in all four games, the fact that there are three teams with 4-0 records (Orioles, Reds, and Rangers) isn't a surprise.

The only surprise in all of this is that the Orioles (widely touted to finish last in the A.L. East) swept the Rays in a three game series in Tampa Bay and then went on to beat the Tigers at home in their fourth game of the season. But then again, the probability of a .400 team going 4-0 against a .500* team is just under 3%.  Not very good odds, but something we would expect to see on occasion.

(Shout out to Tango, who raised the "on pace" problem a couple of days ago, and The Book readers who added various lucid and perceptive comments, including an XKCD cartoon. You can never go wrong using an XKCD cartoon to illustrate your point.)

Update: the New Utosky Bolshevik Show takes the Red Sox 0-3 start as its jumping off point for a post titled The Red Sox Aren't Doomed, demonstrating the same thing I did but with graphs and Python script.  Score one for the NUBS.

* Changed from ".600".  Comment #1 below was generated because of this typo; #2 is my detailed response.

-30-

March 31, 2011

Developing talent

Today (Opening Day 2011), an excerpt from Bill James' forthcoming book Solid Fool's Gold: Detours on the Way to Conventional Wisdom appeared on the Slate site. The article is titled "Shakespeare and Verlander: Why are we so good at developing athletes and so lousy at developing writers?", and in it he provides some profound insights into discrimination in sports compared to the rest of society.

But along the way to that point, James takes a shot at the conventional wisdom that expansion dilutes the talent pool. James' contrary view is that expansion creates a short-term dilution, but over the long term more talent develops to fill the increased demand.

The thesis is built on James' assertion that raw talent is abundant, and simply needs the right opportunities -- incentives -- to be developed. In James' thought experiment, an expansion of MLB from 30 teams to 300 would over the long term have no impact on the level of talent, as talent development would expand to ensure the newly available opportunities were filled.

But can we really believe this?  There has been plenty of discussion elsewhere about the distribution of baseball talent (for example, Sabernomics and The Book), all of which would, at first glance, seem to run contrary to Bill James' argument. But those talent curves are drawn based on the current system of incentives, with enough room for 25 roster players on 30 MLB teams and roughly 9,000 players in pro ball in North America and a few more thousand around the world.

Criticisms  of Bill James' essay will no doubt focus on the fact that expanding the number of MLB teams beyond 30 requires some of the non-roster players currently in the minors to move up to The Show ... they aren't good enough to play today, but in an expansion environment they would be.

This might be true in the short term, but as Bill James argues, over the long haul the change in opportunities would shift, and talent would be developed to fill the new opportunities.

Currently around the margins of professional baseball are men who have given up baseball to work as a bartender, and those who have decided to pursue excellence in another sport. Players in both these groups would demonstrate different behaviour when provided a different set of incentives.  The shape of the distribution curve would not change, and the average player's performance would also be unchanged, but the absolute number of players would increase. 

Tom Wilhelmsen, former bartender, now pitching for the Seattle Mariners.


The latter group (the athletically gifted stars in other sports) would provide the increased numbers of players at the top end of the distribution curve, becoming the star players on Teams #31 through #300.  The bartenders of today would become the focus of rigorous development regimes. It's important to remember that not only would there be 10 times more opportunities at very level, but there would also be 10 times more teams trying to succeed, and 10 times more scouts, coaches, and others keen to see their players develop into stars. And this would be repeated around the world, ensuring that the best athletes are active in the sport that provides the greatest opportunities. Given enough time, there would be enough players developed to stock 300 teams with no decrease in overall quality of play.

There are examples of this in the past. One recent example is the growth of information technology occupations -- 40 years ago, very few individuals (both in terms of absolute numbers and as a percentage of the workforce) knew how to write a computer program. But with increased job opportunities and an expansion of training, people who might otherwise chosen other occupations and career paths now can write computer programs. This does not mean the talent pool of computer programmers has been diluted; in fact, an argument could be made that the average talent and the high-end extreme of talent has increased.

Another parallel is the availability of natural resources that lay unused until somebody found a use for it. Petroleum was known to exist for centuries, but wasn't a sought-after resource until the mid-nineteenth century when a method to distill kerosene was developed, making it a cheap alternative to whale oil. In a short period of time opportunities expanded, and as a result there was a rush to develop this previously ignored resource.

-30-


February 6, 2011

Modeling: insights from the pros

It's been a busy few weeks, so I've spent Super Bowl Sunday* catching up on the various blogs that I try to follow. A couple of posts from Andrew Gelman and Aleks Jakulin caught my eye: Why can't I be more like Bill James, or, The use of default and default-like models and the two-part Model Makers' Hippocratic Oath (Part 1 and Part 2).

All these posts are worth reading in their entirety, but they all boil down to the quote from George E.P. Box: "Essentially, all models are wrong, but some are useful." Knowing (or if you're the author, admitting) the limitations of the model is the most important to understanding how useful a model might be.

*Pitchers and catchers start reporting for spring training one week today!

-30-

January 28, 2011

The risks of adjusting performance stats

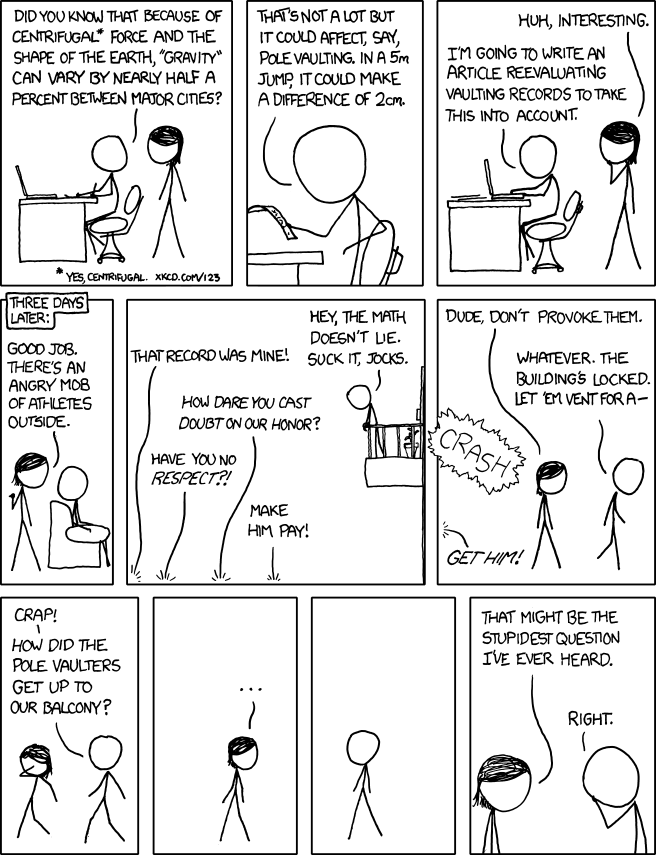
From XKCD.  Not baseball, but it brings to mind park effect, league context, etc.

January 5, 2011

Andrew Gelman's "5 Books"

Andrew Gelman is one of the most interesting (IMHO) social scientist/statisticians in The Academy. Not only does he have serious statistical chops (he co-authored Bayesian Data Analysis with Carlin, Stern, and Rubin), but he also has published a raft of papers on voting patterns. His blog Statistical Modeling, Causal Inference, and Social Science -- written with his colleague Aleks Jakulin -- offers wide ranging commentary on everything from statistical theory and philosophy, to R (the statistical software), to all manner of social statistics.
Gelman was recently approached by The Browser to suggest five books on how people vote in the U.S., but instead he provided a list of five excellent books about statistics.  #1 on his list:  Bill James’ Baseball Abstracts 1982-1986.

-30-